TL;DR
To optimize medical ventilator performance, it is critical to accurately model the Pressure-Volume (P-V) curve of the human lung. This project involved developing a MATLAB-based computational suite that models these curves using 3rd-order polynomial interpolation and quantifies the “work of breathing” through three distinct numerical integration methods: Trapezoidal, Simpson 1/3, and Simpson 3/8.
Problem
In medical engineering, ventilator efficacy is directly tied to its ability to manage a patient’s respiratory effort. The work performed during breathing is mathematically represented by the area under the P-V curve ().
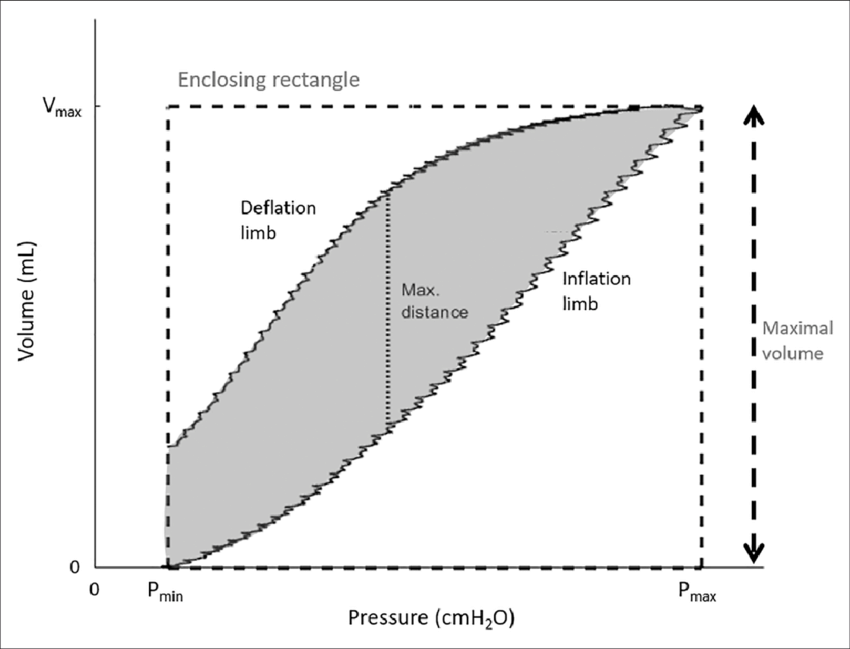
The area within this curve provides critical diagnostic data:
- During Inspiration: The area represents the energy expended by respiratory muscles to overcome elastic and resistive forces.
- During Expiration: The area represents the work of elastic recoil.
To provide effective ventilation while minimizing patient strain, engineers must precisely calculate these values. The primary engineering challenge was to develop a system capable of processing raw clinical data points into high-fidelity curves to determine these critical metrics with high precision.
Design Iterations
The development process followed a structured three-stage engineering workflow:
1. Data Modeling & Interpolation
Raw patient data—typically consisting of non-linear, discrete points—requires interpolation to generate a continuous curve for calculation. I implemented Newton’s Interpolating Polynomials to model these curves. This method was selected over standard matrix inversions to ensure superior numerical stability when processing potentially ill-conditioned datasets.
2. Numerical Integration Suite
To provide flexibility regarding precision and computational overhead, I integrated three distinct algorithms to calculate the area under the curve:
- Trapezoidal Rule: A foundational method that approximates the area by dividing it into a series of trapezoids.
- Simpson 1/3: A quadratic approximation providing significantly higher accuracy than the trapezoidal method for smooth curves.
- Simpson 3/8: A cubic approximation utilized for even higher precision when the number of segments allows for optimal sampling.
3. Validation & Verification
To ensure clinical reliability, the software was validated against three benchmarks:
- Analytical Solutions: Comparing results against manually calculated values for known functions.
- Standard Tools: Cross-referencing outputs with industry-standard Simpson’s Rule calculators.
- Cross-Validation: Comparing the outputs of all three integration methods to ensure consistent results across different algorithmic approaches.
Technical Details
The system architecture utilizes a modular MATLAB framework to ensure scalability and clarity:
newton_poly.m: Manages the construction of the 3rd-order polynomial using finite differences.main.m: Functions as the primary controller, handling user input (P1-P4 data), selecting the integration method, and calculating final metrics such as Net Work, Max Pressure, and Maximum Volume.- Dynamic Sampling: The system automatically partitions the distance between data points into 60 equally spaced segments to ensure high-resolution integration.
Results & Key Metrics
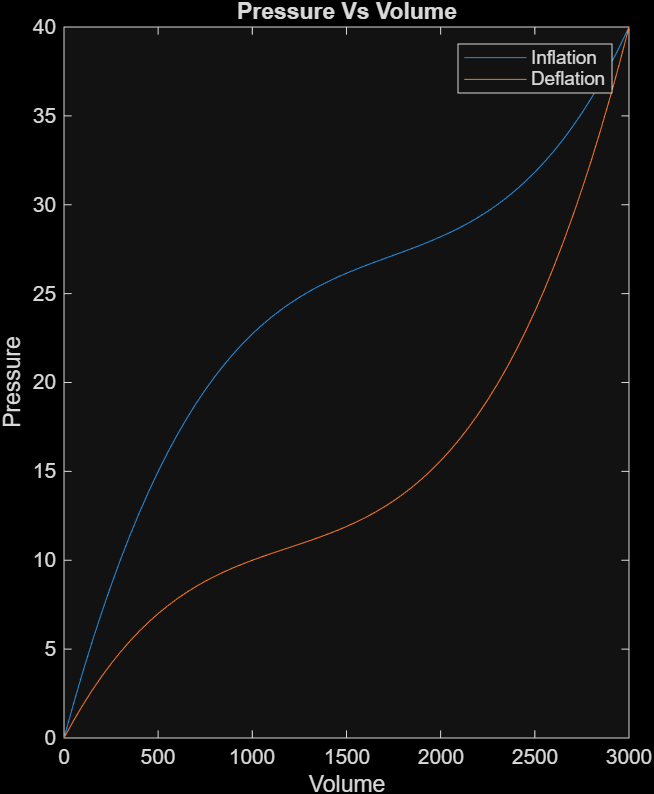
The system successfully processed multiple test cases, yielding consistent results across all three numerical integration methods.
- Accuracy: The Simpson 3/8 and Simpson 1/3 methods provided high-fidelity results that aligned closely with analytical expectations.
- Visualization: The tool generates a dual-curve plot (Inspiration vs. Deflation), enabling clinicians to visualize the pressure-volume relationship clearly.